
前言
最近有机会了解了Prometheus监控的原理,也从零搭建了一套基于Prometheus的系统监控平台。这里面涉及到了很多的概念、系统、模块,比如alertmanager、exporter、grafana等等,如果长时间不接触,大概率又会忘掉。所以本文的主要目的是记录整体系统的监控流程以及介绍各系统、模块的功能与作用。
系统拓扑
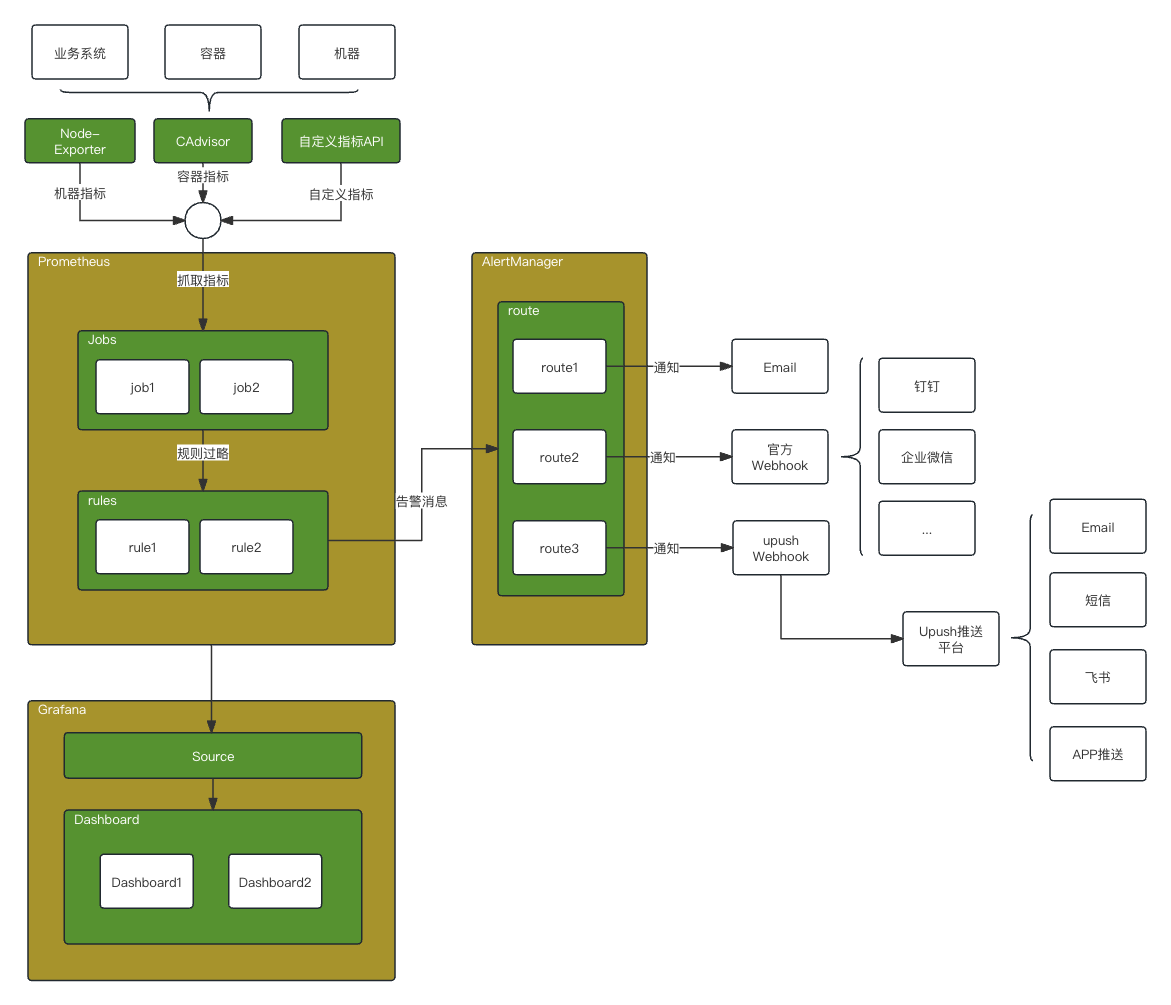
如上图所示,prometheus主要通过配置job定期抓取系统指标,再通过rules计算出告警消息。接着,将告警消息交给AlertManager,由它进行告警通知。在AlertManager中配置route规则,将不同类型的告警消息推送到不同的渠道,如邮件、钉钉、企业微信等等。若想推送到飞书等其他系统,可通过自定义webhook的方式将告警消息接入到外部系统。
关于指标数据,在prometheus生态中有诸如node-exporter、CAdvisor等现有的系统,可以快速生成指标,帮助我们快速监控。
系统与模块的详细说明
Prometheus
prometheus是一个开源的服务监控系统和时间序列数据库。一般情况下,被监控系统只需要提供指标API接口,由prometheus主动拉取数据。
在prometheus中的job、rule等,都是通过配置文件prometheus.yml指定的,配置文件如下:
1
2
3
4
5
6
7
8
9
10
11
12
13
14
15
16
17
18
19
20
21
22
23
24
25
26
27
28
29
30
31
32
33
34
35
# my global config
global:
  scrape_interval:     15s # Set the scrape interval to every 15 seconds. Default is every 1 minute.
  evaluation_interval: 15s # Evaluate rules every 15 seconds. The default is every 1 minute.
  # scrape_timeout is set to the global default (10s).

# Alertmanager configuration
alerting:
  alertmanagers:
  - static_configs:
    - targets:
      # - alertmanager:9093

# Load rules once and periodically evaluate them according to the global 'evaluation_interval'.
rule_files:
  # - "first_rules.yml"
  # - "second_rules.yml"

# A scrape configuration containing exactly one endpoint to scrape:
# Here it's Prometheus itself.
scrape_configs:
  - job_name: 'agent_linux'
    static_configs:
    - targets: ['192.168.175.129:9100']
      labels:
        name: linux_db1

  - job_name: 'elasticsearch'
    scrape_interval: 60s
    scrape_timeout:  30s
    metrics_path: "/metrics"
    static_configs:
    - targets: ['192.168.75.21:9308']
      labels:
       service: elasticsearch
alerting就是配置AlertManager系统的地址,rule_files配置告警规则,scrape_configs配置拉取指标任务。
规则文件内容如下:
1
2
3
4
5
6
7
8
9
10
groups:
- name: simulator-alert-rule  #组名称
  rules:
  - alert: HttpSimulatorDown #报警名称,必须唯一
    expr: sum(up{job="agent_linux"}) == 0  #监控指标表达式,这里是验证 agent_linux 节点是否是可访问的
    for: 1m  #持续时间,1分钟内表达式持续生效则报警,避免瞬间故障引起报警的可能性
    labels:
      severity: critical
    annotations:
			summary: Linux node status is % for 1m  #警报描述
expr中便是告警逻辑,一旦采集到的数据满足表达式,便会产生一条告警。若此时配置了AlertManager,它会将告警推送给AlertManager,由它进行处理。
Grafana
Grafana是一个图表化数据展示的平台,它支持通过配置文件的方式,构建出丰富的、直观的数据展示窗口。它支持很多数据源的展示,这里主要配置prometheus进行数据展示。
我们可以通过Dashboard官网直接获取通用的面板配置,稍加改动即可满足自己系统的需求。
AlertManager
AlertManager是用来对接prometheus的,它接收prometheus的告警消息,主要作用是将告警消息以不同的渠道通知给负责人。
它也是通过配置文件配置的,通过route规则将不同消息路由给不同的receivers,在receivers中指定好了通知渠道。
配置文件alertmanager.yml内容如下:
1
2
3
4
5
6
7
8
9
10
11
12
13
14
15
16
17
18
19
20
21
22
23
24
25
26
27
28
29
30
31
32
33
34
35
36
37
38
39
40
41
42
43
44
global:
      # 在没有报警的情况下声明为已解决的时间
  resolve_timeout: 5m
      # 配置邮件发送信息
  smtp_smarthost: 'smtp.qq.com:25'
  smtp_from: 'xxx@qq.com'
  smtp_auth_username: 'xxx@qq.com'
  smtp_auth_password: 'xxx'
  smtp_require_tls: false  # 禁用tls


templates:
  # - 'test.tmpl'
  # 所有报警信息进入后的根路由,用来设置报警的分发策略
route:
  # 这里的标签列表是接收到报警信息后的重新分组标签,例如,接收到的报警信息里面有许多具有 cluster=A 和 alertname=LatncyHigh 这样的标签的报警信息将会批量被聚合到一个
分组里面
  group_by: ['alertname', 'cluster']
  # 当一个新的报警分组被创建后,需要等待至少group_wait时间来初始化通知,这种方式可以确保您能有足够的时间为同一分组来获取多个警报,然后一起触发这个报警信息。
  group_wait: 30s

  # 当第一个报警发送后,等待'group_interval'时间来发送新的一组报警信息。
  group_interval: 10s

  # 如果一个报警信息已经发送成功了,等待'repeat_interval'时间来重新发送他们
  repeat_interval: 10s

  # 默认的receiver:如果一个报警没有被一个route匹配,则发送给默认的接收器
  #receiver: "default"
  receiver: "wechat"

receivers:
- name: 'default'  # 自定义名称 供receiver: default使用
  email_configs:   # 邮件报警模块
  - to: '815202984@qq.com'
    send_resolved: true

- name: 'wechat'
  wechat_configs:
    - send_resolved: true
      agent_id: '1000002'  #应用ID
      to_user: 'GuoChaoQun|Zhangsan' #接受成员账号
      api_secret: 'xxx' #应用秘钥
      corp_id: 'xxx' #企业微信ID
如果需要对接三方的通知系统,可基于
webhook的方式实现自定义系统。如想推送到飞书通知,可自定义一个feishu-webhook服务,数据流如下:prometheus->alertmanager->feishu-webhook->feishu
node-exporter
node-exporter是众多exporter中的一个,它主要监控宿主机的运行指标,并暴露指标接口给prometheus。它帮助我们快速的监控机器的运行状态,包括CPU、存储、内存等等数据。
CAdvisor
CAdvisor主要监控机器上的容器状态,并暴露指标接口给prometheus。通过它我们可以快速的监控容器的运行情况。
总结
在prometheus的监控体系内,主要分为了4个角色:
被监控者。
它只需要提供指标接口,等待prometheus来拉取指标数据即可。
监控者Prometheus。
Prometheus作为监控大脑,它会定期去拉取所有系统的指标数据。满足预设的告警规则就会产生告警消息,但它自身无法通知。它会将消息告知AlertManager。
通知者AlertManager。
AlertManager作为Prometheus的下游,处理Prometheus的告警消息,根据预设的消息路由规则将告警消息通知到不同的接受者,如邮箱、微信等等。
接收者。
目前AlertManager官方支持多种receivers,如邮箱、微信、企业微信等等。若三方的通知系统不在官方的支持名单内,可通过自定义webhook的方式实现支持。